For: Risk Advisory Group
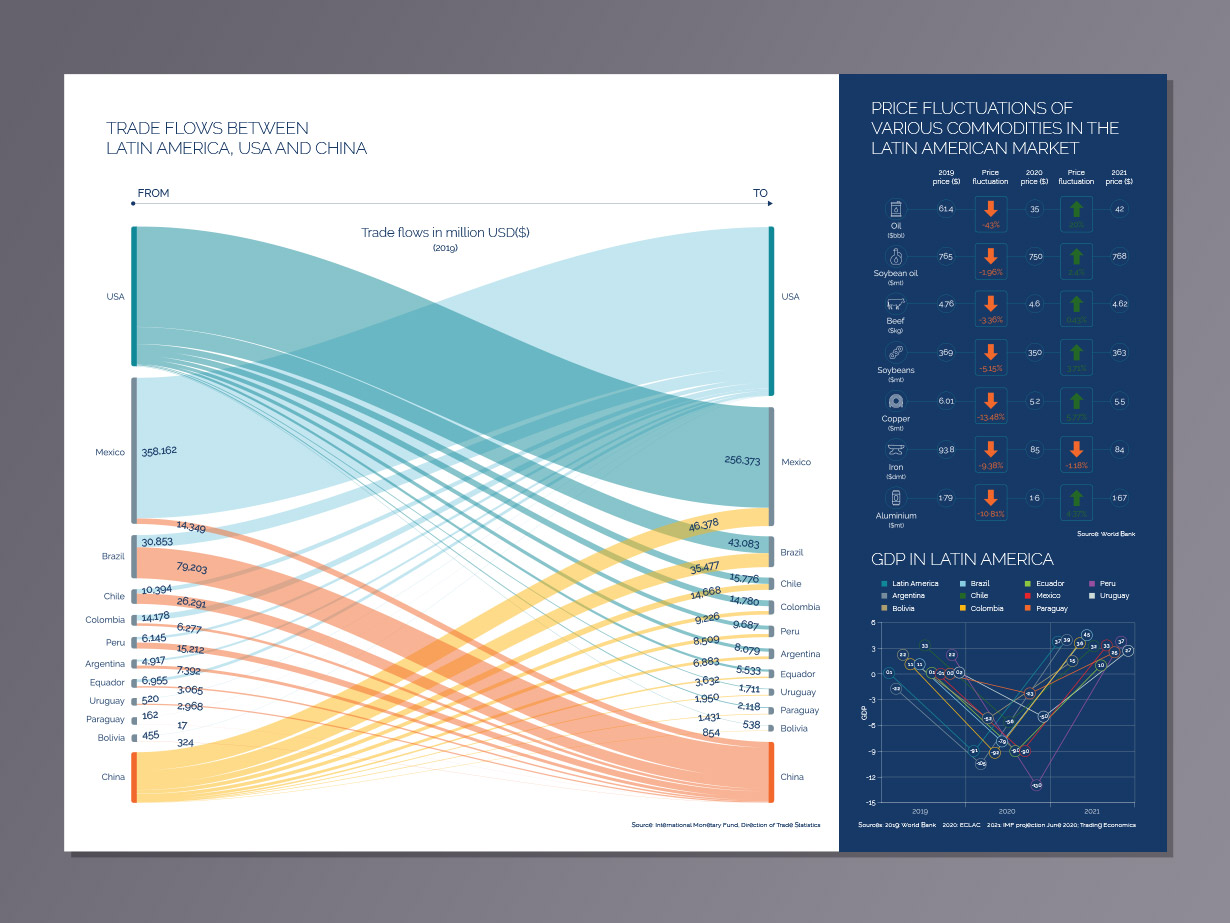
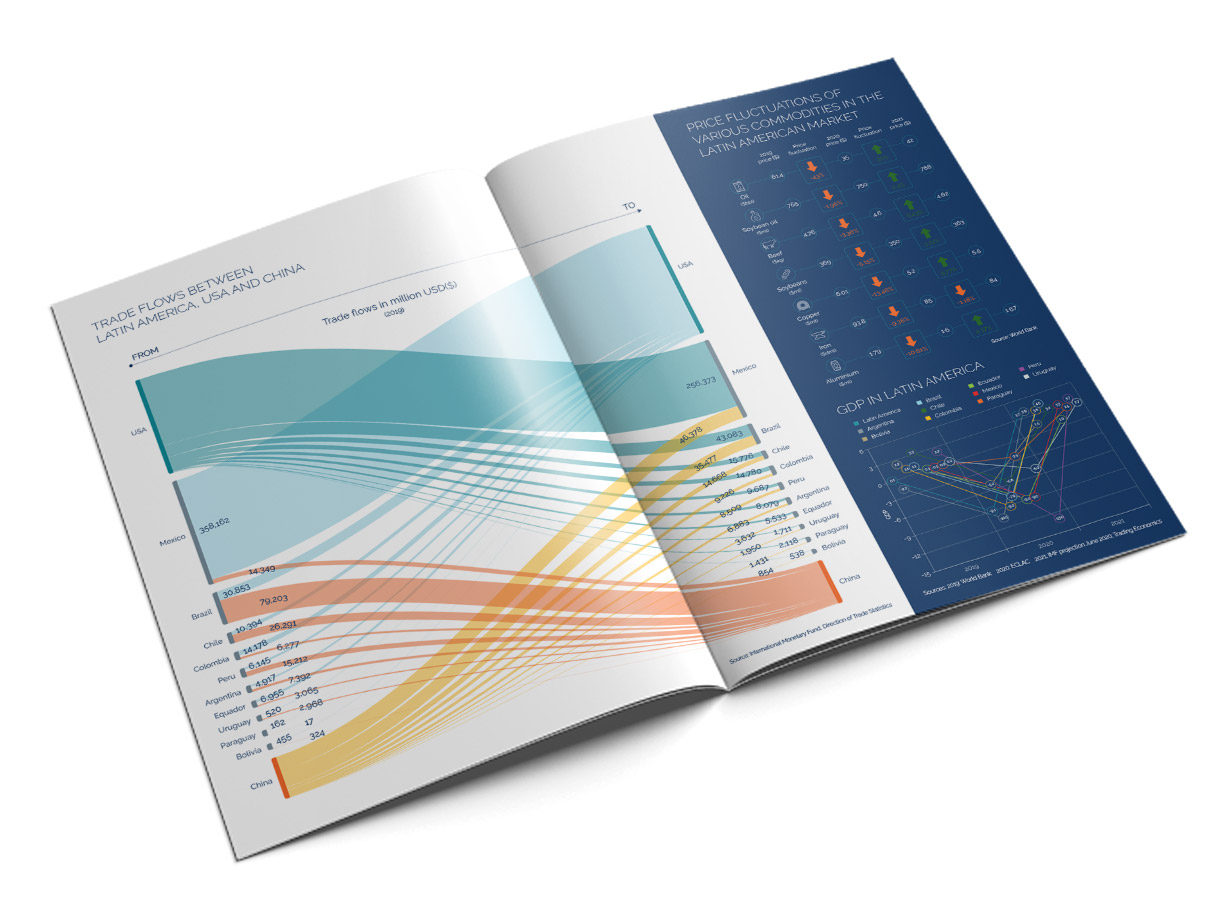
Brief: Produce highly visual graphic interpretations of given data sets for an A4 report.
Responsibilities: Using data on trade flows between Latin America and USA and China and following the Risk Advisory brand guidelines, to create up to three diagrams visualising the information in a clear and concise way.
Outcomes: Three separate diagrams spread across an A4 double spread, with the most complex being given centre stage.